Profitable trading relies on identifying recurring market behaviors using technical analysis patterns that signal when institutional money is moving into or out of a position. By recognizing these formations early, you can align your capital with the prevailing trend instead of fighting against it.
Key Takeaways
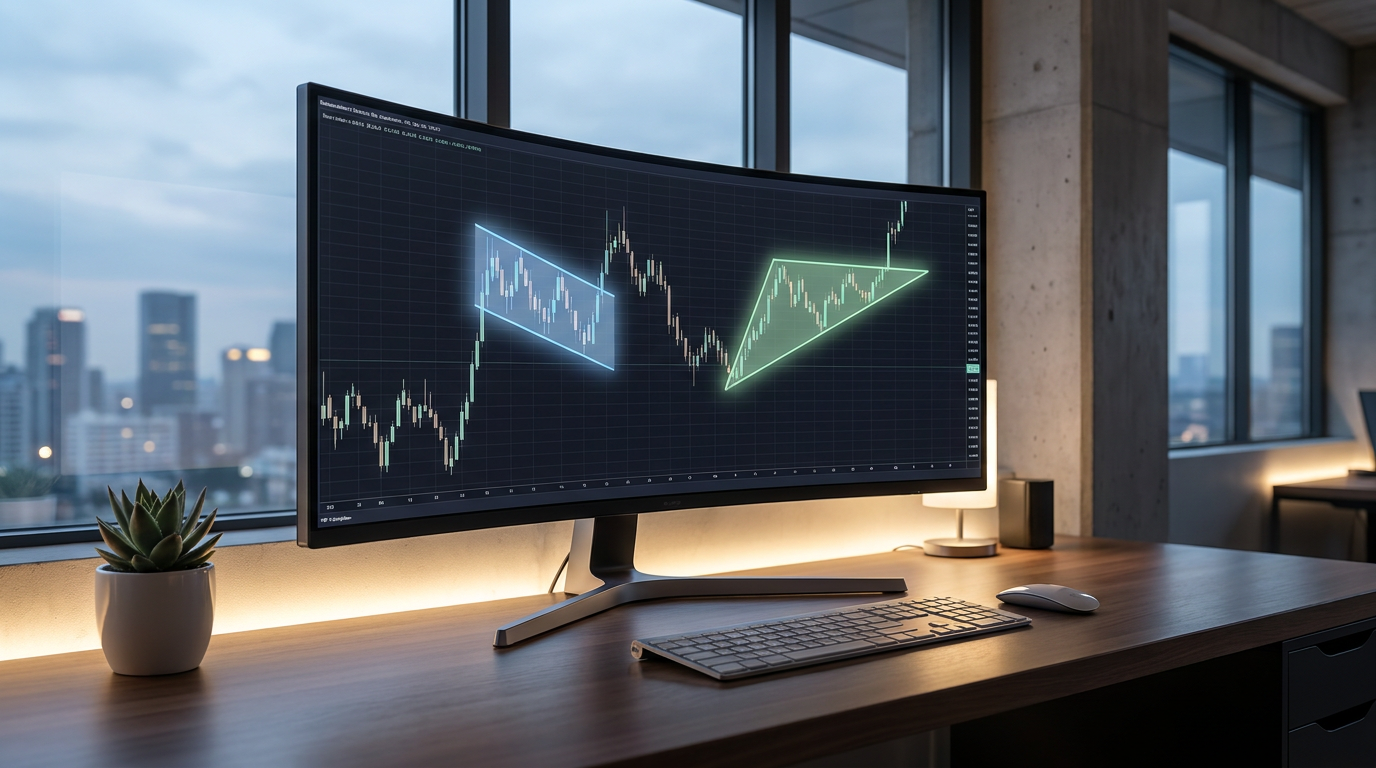
- Continuity patterns like bull flags offer high-probability entries with a 65-70% historical success rate when backed by volume.
- Volume confirmation is the single most important filter for avoiding “fakeout” patterns that trap retail traders.
- Combining chart formations with automated alerts reduces emotional bias and improves entry timing.
Why do technical analysis patterns actually work?
Many skeptics claim that looking at lines on a chart is just modern-day astrology. But they’re missing the point. These patterns work because they represent the collective psychology of millions of traders and the footprints of massive algorithms.
When you see a “Head and Shoulders” or a “Cup and Handle,” you aren’t just looking at a pretty shape. You’re seeing a visual representation of a battle between buyers and sellers where one side is clearly losing steam. And honestly? If you aren’t using advanced charting platforms to visualize this data, you’re trading with one eye closed.
The real secret isn’t just finding the pattern; it’s understanding the context. A breakout on low volume is usually a trap. A breakout on massive volume? That’s an invitation to the party.
How can you spot a high-probability breakout?
I think the biggest mistake most people make is jumping the gun. They see a pattern forming and they buy before the breakout is confirmed. This is a recipe for disaster. You need to wait for the candle to close outside the pattern boundary.
Look for “consolidation” zones. This is where the price moves sideways in a tight range, like a coiled spring. The longer the price stays in that range, the more explosive the eventual move will be. I’m a MASSIVE fan of using automated trendlines and smart alerts to catch these moves the second they happen.
And don’t ignore the broader market. A perfect bullish flag on an individual stock doesn’t mean much if the entire S&P 500 is cratering. You want the wind at your back, not in your face.
Which patterns are the most reliable for beginners?
If you’re just starting out, keep it simple. The “Flag” and “Pennant” are your best friends. These are continuation patterns, meaning the stock takes a quick breather before continuing its original move. They’re much easier to trade than reversal patterns, which require you to catch a falling knife.
But here’s what most people get wrong: they forget to check what the “smart money” is doing. Retail traders look at the chart, but pros look at the flow. I highly recommend using an options order flow platform to see if hedge funds are buying aggressive calls while that pattern is forming. If the chart says “buy” and the smart money is also buying, that’s a high-conviction trade.
Quick reality check. No pattern is 100% foolproof. You will get stopped out. The goal isn’t to be right every time; it’s to ensure your wins are significantly larger than your losses.
Can AI help you identify these setups faster?
We’re living in 2026, and manually scanning 5,000 stocks for a triangle pattern is a waste of your time. The tech has evolved. You can now use AI-powered stock scanners that hunt for momentum and specific chart setups in real-time.
These tools don’t just find the pattern; they backtest it for you. They’ll tell you that a specific setup has worked 72% of the time over the last six months in the current market volatility. That kind of data gives you the confidence to actually pull the trigger when the setup appears.
Let me explain why this matters. Trading is 10% strategy and 90% discipline. When an AI tells you the odds are in your favor, it’s much easier to stick to your plan and avoid the “panic sell” button.
What This Means for You
Technical analysis patterns are the language of the market. Once you learn to read them – and combine them with volume and smart money tracking – you stop guessing and start calculating. Start with one or two simple continuation patterns, use professional tools to verify the data, and always, always protect your downside with a stop loss.
Frequently Asked Questions
Do chart patterns work for crypto too?
Yes, technical analysis patterns are often even more pronounced in crypto due to the high retail participation and emotional extremes of that market.
What is the most successful chart pattern?
While results vary, the “High and Tight Flag” is widely considered one of the most powerful bullish setups, often preceding moves of 20% or more.
Should I trade patterns on a 5-minute chart?
Day traders do this, but patterns on longer timeframes (like the daily or weekly chart) are generally much more reliable and less prone to random market noise.
FREE MASTERCLASS: 3 Secrets to Take Control of Your Financial Future!